Source Apportionment of Total Suspended Particulate in the Central Himalayan Region
Researchers at the Aryabhatta Research Institute of Observational Sciences (ARIES), Nainital an autonomous research institute under the Department of Science and Technology (DST) Govt. of India and other institutes from India and other countries studied the chemical composition and source apportionment of total suspended particulate in the central Himalayan region. The main source regions for aerosols at remote background location (i.e. Nainital) were the plains in northwest India and Pakistan, polluted cities like Delhi, the Thar Desert and the Arabian Sea area. The outcomes of this study are expected to elucidate the atmospheric chemistry, emission source origins and transport pathways of aerosol over the Central Himalayan region.
It is well known that the Himalayan region, with a unique role in the Asian climate, is considered as a vulnerable environment regarding aerosol dynamics and impacts. Several chemical speciation studies have been performed for carbonaceous aerosols and inorganic species over the western and central Himalayan regions during the last decade, reporting the dominance of transported aerosol plumes from the IGP. However, there is a knowledge gap regarding the primary and secondary organic carbon (POC, SOC) fractions, along with a lack of receptor modeling works in the central Indian Himalayas. Furthermore, source apportionment studies over the central Himalayan region are required for assessment of contributions and temporal variability of sources that influence the area through regional transport.
The present research work provides a source apportionment of total suspended particulate matter over the remote background location in central Himalayan region. This study was led by Mr. Rahul Sheoran (Ph. D. Student ARIES, Nainital, India), Dr. Umesh Chandra Dumka (Scientist, ARIES, Nainital, India) along with the contributions by Prof. Dimitris G Kaskaoutis (Scientist, NOA, Greece), Prof. G. Grivas (Scientist, NOA, Greece), and Prof. Nikos Mihalopoulos (Director, NOA, Greece), Dr. Kirpa Ram (Faculty, BHU, India), Dr. Jai Prakash (Visiting Scientist, Washington University, USA), Dr. Rakesh K Hooda (Scientist, FMI, Finland), and Prof. Rakesh K Tiwari (Faculty DDU, India), and was published in the international peer-reviewed journal of “Atmosphere (MDPI Publications)”.
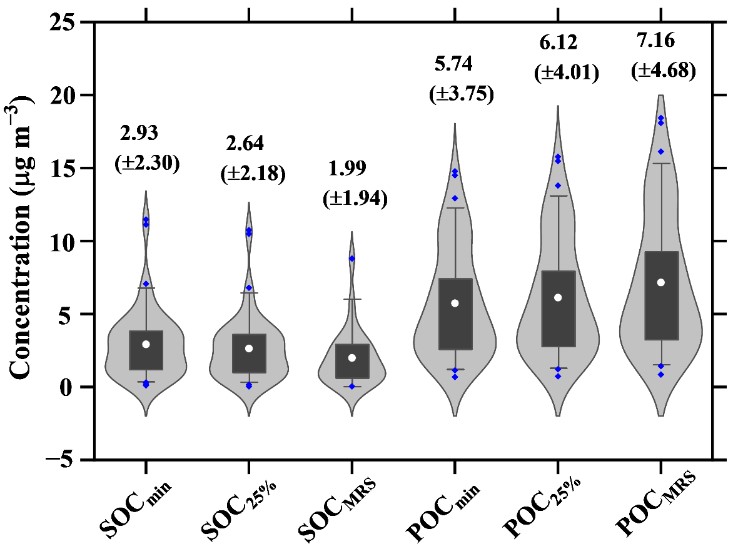
Figure 1: SOC and POC concentration (violin plots) at Nainital using the minimum, 25th percentile, and MRS method. The box shows the 25th –75th percentiles, while the open circle corresponds to the mean, which was given in the graph along with the standard deviation (whiskers).
The results show the TSP concentration of 69.6 ± 51.8 µg m−3, exhibiting a pre-monsoon (March–May) maximum (92.9 ± 48.5 µg m−3) due to dust transport and forest fires and a monsoon (June–August) minimum due to atmospheric washout, while Carbonaceous aerosols (OC, EC) maximized in winter due to the intensification of biomass burning (e.g., wood burning, crop residual burning, etc.) over the IGP and the Himalayas for domestic heating and the shallower mixing layer. The high OC/EC ratio (8.0 ± 3.3), along with a good correlation between OC, EC, and nss-K+, suggested a significant effect of biomass-burning aerosols, while the relatively high WSOC/OC ratio (0.57 ± 0.15) indicated significant contributions of biomass burning, secondary, or aged organic aerosols over Nainital. The estimated SOC fractions via the EC tracer method accounted for ~25% (ranges of 19.3–29.7%) of total carbon (OC + EC), and were consistent between different approaches for the calculation of primary OC/EC ratios in the EC tracer method.
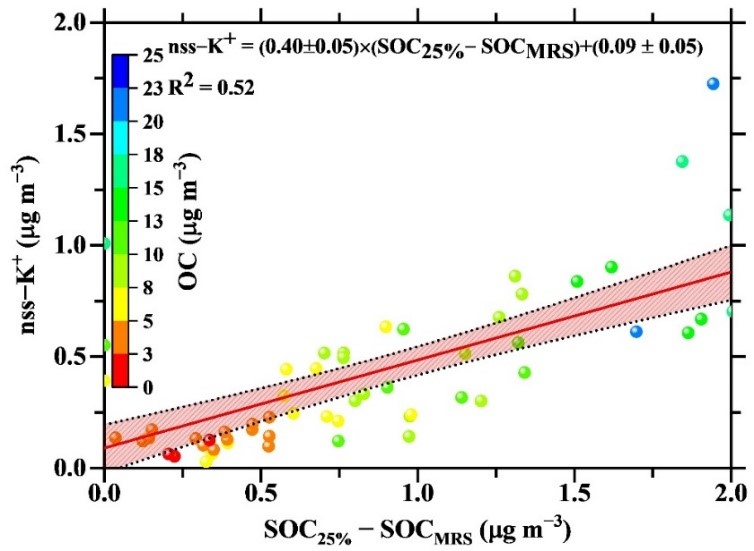
Figure 2: Correlation between the differences in SOC concentration derived from the 25th percentile and MRS methods with nss-K+ as a function of the OC concentration (colored scale) in Nainital. The red line shows the linear regression and the red shaded area the limits of the linear regression at 95% confidence level.
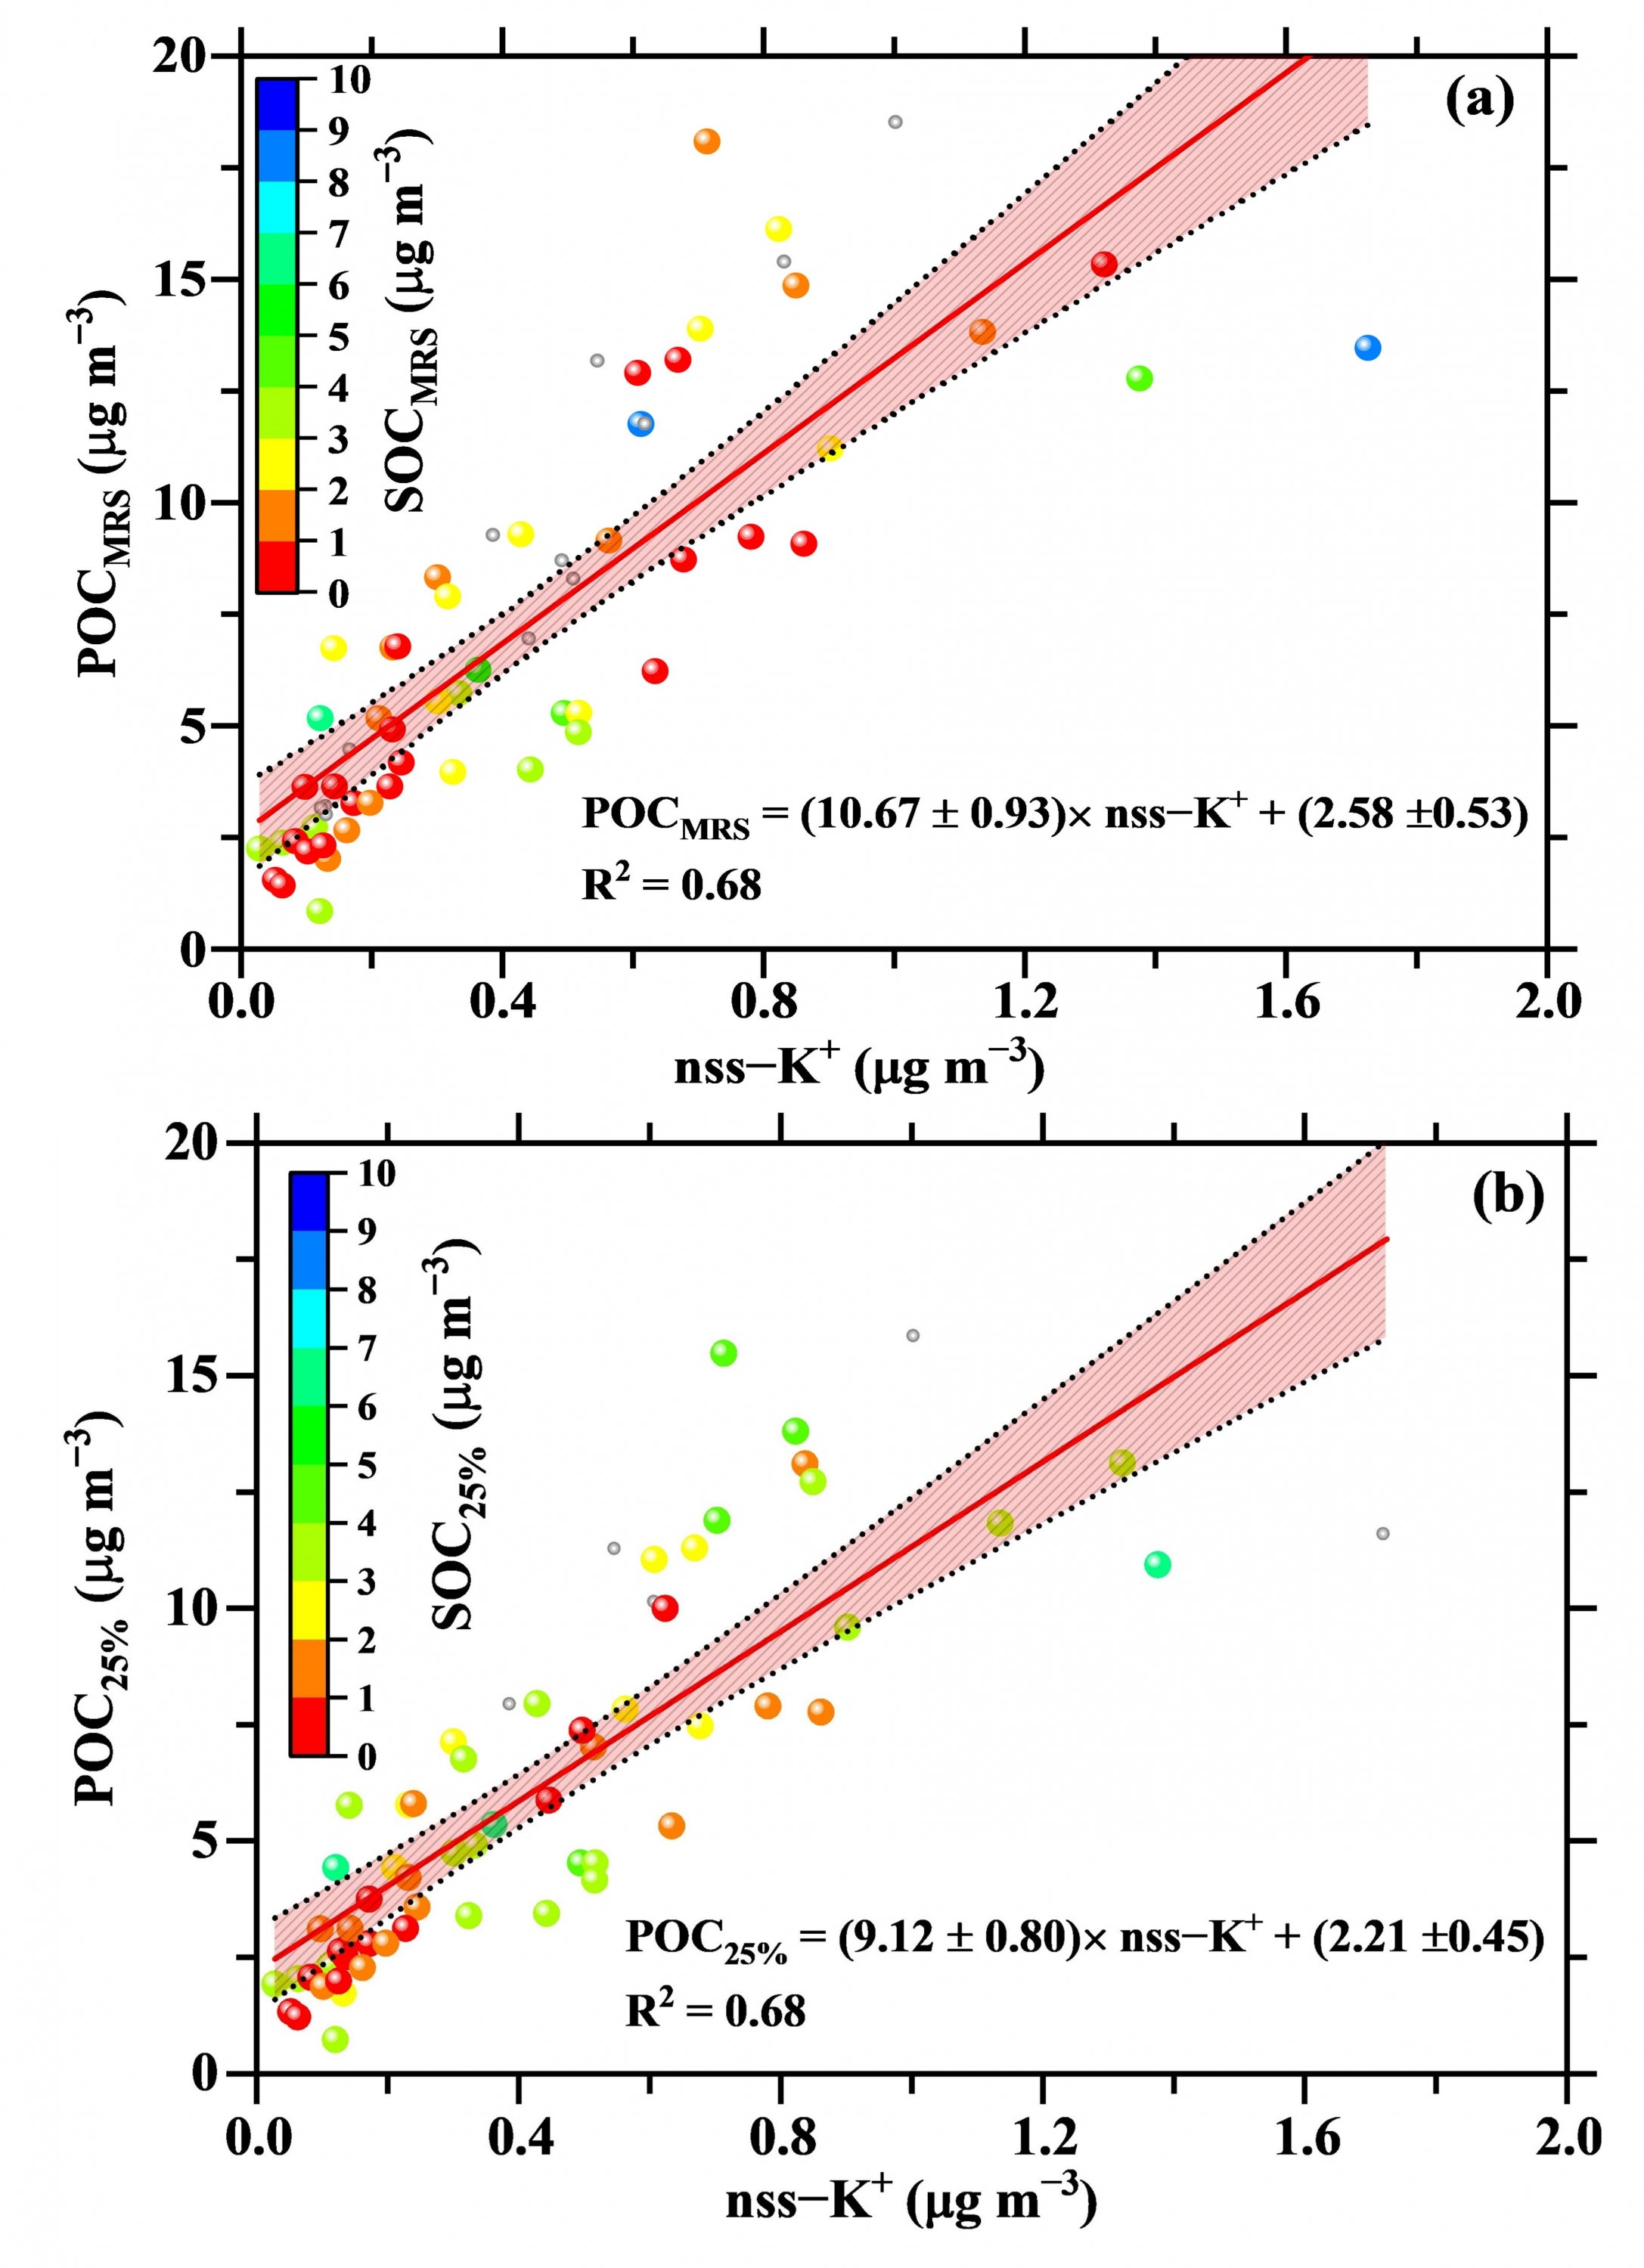
Figure 3: Correlations between nss-K+ and POC estimates via the MRS (a) and 25th percentile (b) methods in Nainital as a function of the respective SOC estimates. The red line shows the linear regression and the red shaded area the limits of the linear regression at 95% confidence level.
Publication: Rahul Sheoran et al., 2021, Atmosphere, 12(9), 1228
Publication Link: https://www.mdpi.com/2073-4433/12/9/1228
For more details, please contact Dr. Umesh Chandra Dumka (dumka@aries.res.in; 09897559451) and Mr. Rahul Sheoran (rahul.sheoran@aries.res.in; 08607025801)