TIRCAM2
TIRCAM2 (TIFR Near Infrared Imaging Camera – II)
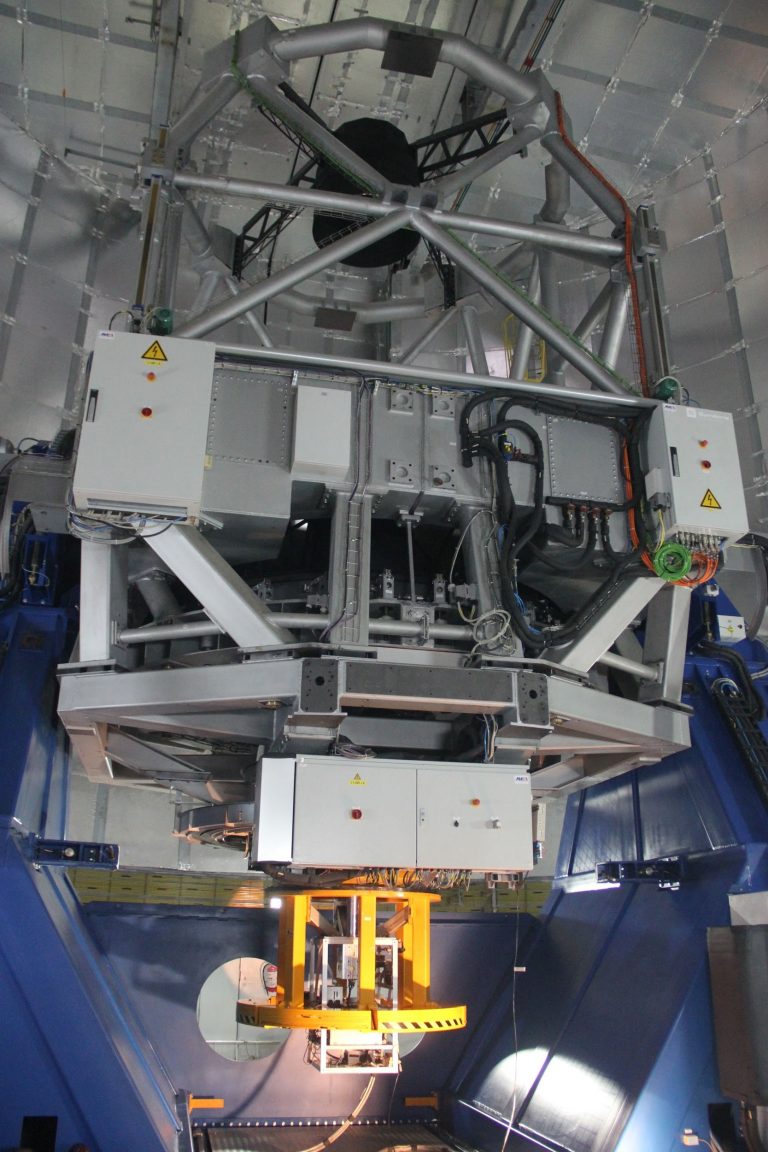
TIRCAM2 (TIFR Near Infrared Imaging Camera – II) is a closed cycle cooled imager that has been developed by the Infrared Astronomy Group at Tata Institute of Fundamental Research for observations in the near infrared (NIR) band of 1 to 3.7 μm. Figure 1 shows the TIRCAM2 system mounted at the main port of the DOT.
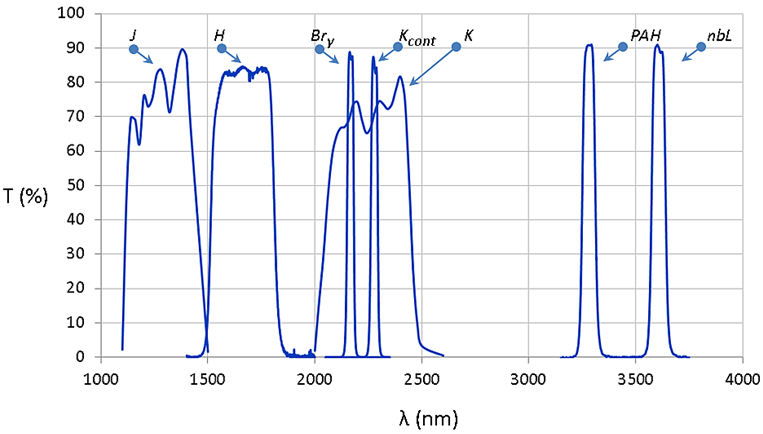
TIRCAM2 is sensitive between 1 and 5 μm and contains selectable standard NIR filters J, H, K, Kcont, Br-Gamma, Polycyclic Aromatic Hydrocarbon (PAH) and narrow-band L (nbL) for imaging. Table 1 lists the details of the imaging filters and Figure 2 shows the transmission curves of the filters. TIRCAM2 uses a 512 x 512 InSb Aladdin III Quadrant focal plane array. It is cooled to an operating temperature of 35 deg K by a closed cycle Helium cryo-cooler. TIRCAM2 is currently the only NIR imaging camera in the country which can observe up to L band in NIR. The dark current measured was ~12 electrons/sec and the readout noise was ~30 electrons for the FPA. The median gain of the detector was found to be ~10 electrons/ADU.
Table 1: TIRCAM2 Filter Characteristics
| Filter | λcen (μm) | ∆λ (μm) |
| J | 1.20 | 0.36 |
| H | 1.60 | 0.30 |
| Br-Gamma | 2.16 | 0.03 |
| K | 2.19 | 0.40 |
| Kcont | 2.17 | 0.03 |
| PAH | 3.27 | 0.06 |
| nbL | 3.59 | 0.07 |
The Field-of-View (FoV) of TIRCAM2 on DOT is 86.5 x 86.5 arcsec2. Pixel Scale of TIRCAM2 on DOT is 0.169 +/- 0.002 arcsec/pixel. With typical 1.2 arcsec seeing conditions, TIRCAM2 heavily oversamples the star profile. This pixel sampling is ideal for high accuracy photometry of bright NIR sources. For details of the TIRCAM2 instrument and calibration see the following paper:Naik, M. B., Ojha, D. K., Ghosh, S. K., et al. ‘TIRCAM2: The TIFR Near Infrared Imaging Camera’. Bull. Astr. Soc. India (BASI) 40 (2012): 531–545.
Optimal Observation Strategy
The observation strategy for TIRCAM2 is largely standard NIR observation strategy which involves taking flats in the morning and evening twilight. Dithered short exposure observations of the target star as well as a nearby NIR photometric standard star with 5-point dithered pattern is sufficient. The only additional step needed in TIRCAM2 observations is additional blank sky images of identical exposures. This is to remove a non-uniform additive illumination in TIRCAM2 images. During data reduction they are to be removed by subtracting these blank sky images before the flat-fielding step.
Performance of TIRCAM2 with the 3.6m DOT during the Early Science Cycle (11 – 23 May 2017)
TIRCAM2 had its early science runs with the 3.6-m DOT telescope during 11 – 23 May 2017. The weather conditions during these nights were generally clear but with high relative humidity of typically more than 60%. It is expected to achieve better numbers during the winter cycle than what are being reported below.
- Typical seeing during May 2017 nights was < 1.0 arcsec in the NIR bands.
- Best seeing achieved during these nights was ~6 arcsec in K-band.
Figure 3 shows an example image with seeing (FWHM) of ~0.6 arcsec.
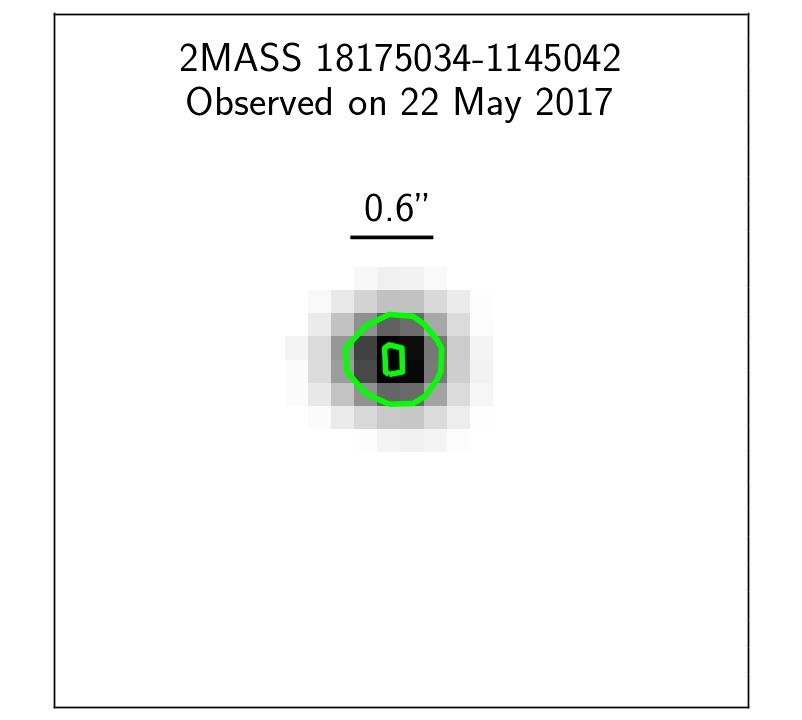
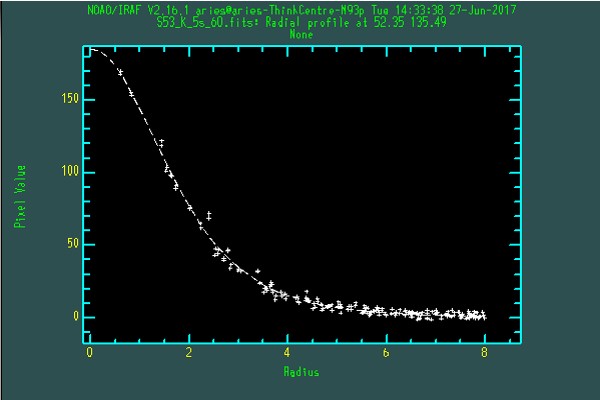
Figure 3: Upper panel shows cut-out of a stellar image observed with TIRCAM2 in K-band on 22 May 2017 towards the Serpens OB2 association. Typical seeing on this night was ~0.6 arcsec. The outer green contour shows the stellar FWHM of the image. The lower panel shows the radial profile of the image shown in the upper panel.
Limiting magnitudes in different NIR bands:
The limiting magnitudes in JHKL bands obtained from the analysis of several target fields (viz. globular clusters, star-forming regions, etc.) are the following:
- J-band : 0 mag (S/N ~ 10); for a total exposure time of 550s
- H-band : 8 mag (S/N ~ 10); for a total exposure time of 550s
- K-band: 0 mag (S/N ~ 10); for a total exposure time of 1000s
- L-band: 2 mag (detection limit); for a total exposure time of 20s
Figure 4 shows the typical DAOPHOT errors in magnitude as a function of JHK magnitudes.
Figure 5 shows the exposure times required for different magnitude stars to achieve a signal-to-noise ratio of 20.
A colour composite image of M92 globular cluster generated using TIRCAM2 J (blue), H (green) and K (red) images, is presented in Figure 6. A 2MASS image of the same region is also presented for comparison.
Figure 7 shows a mosaic image made using four TIRCAM2 J-band images (each with 550 sec exposure) of NGC 4567 & NGC 4568 twin galaxies observed on 15 May 2017.
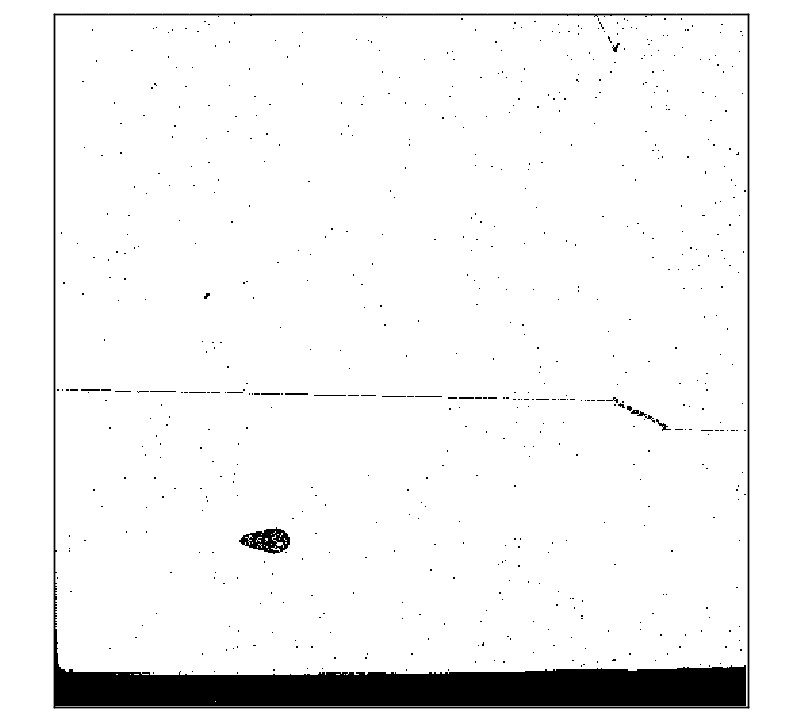
A mask for bad pixels in TIRCAM2 array is also constructed and presented in Figure 8.
Typical Sky brightness at Devasthal (May 2017):
The typical values of sky brightness values obtained in good night conditions (during May 2017) are the following:
- J-band : 4 mag / arcsec2
- H-band : 0 mag / arcsec2
- K-band: 12.2 mag / arcsec2
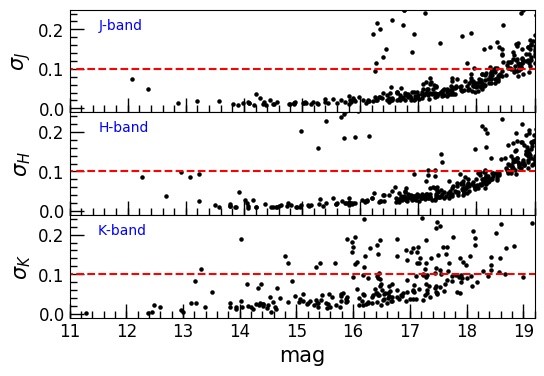
Figure 4: J, H and K magnitudes versus magnitude errors observed with effective exposure times of 550, 550 and 1000s, respectively. The photometry was carried out with an aperture of radius 1 FWHM.
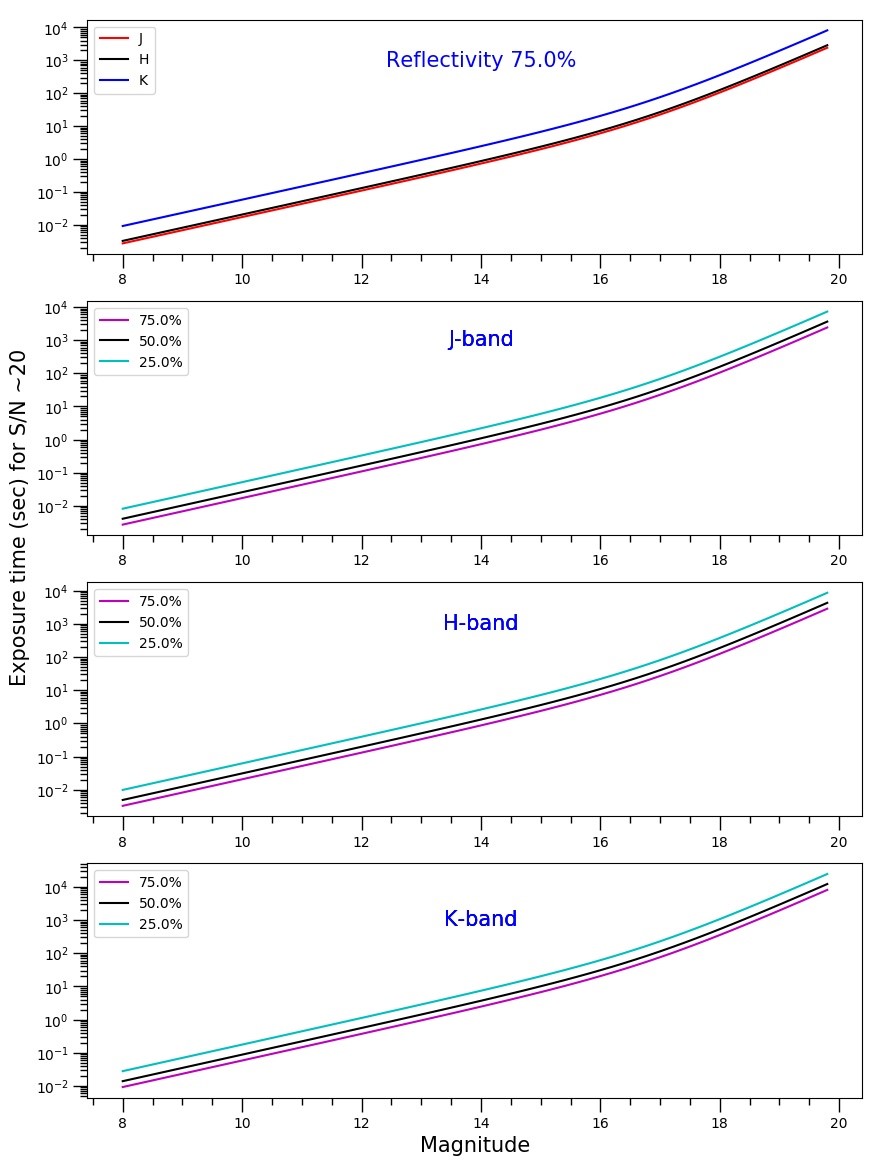
Figure 5: Estimated exposure times required for photometry in TIRCAM2 JHK bands to achieve S/N∼20 on a typical DOT night. The top panel shows sensitivity for all bands with 75% M1 mirror reflectivity, while other three panels show sensitivity for 75%, 50%, and 25%, separately for each band, respectively.
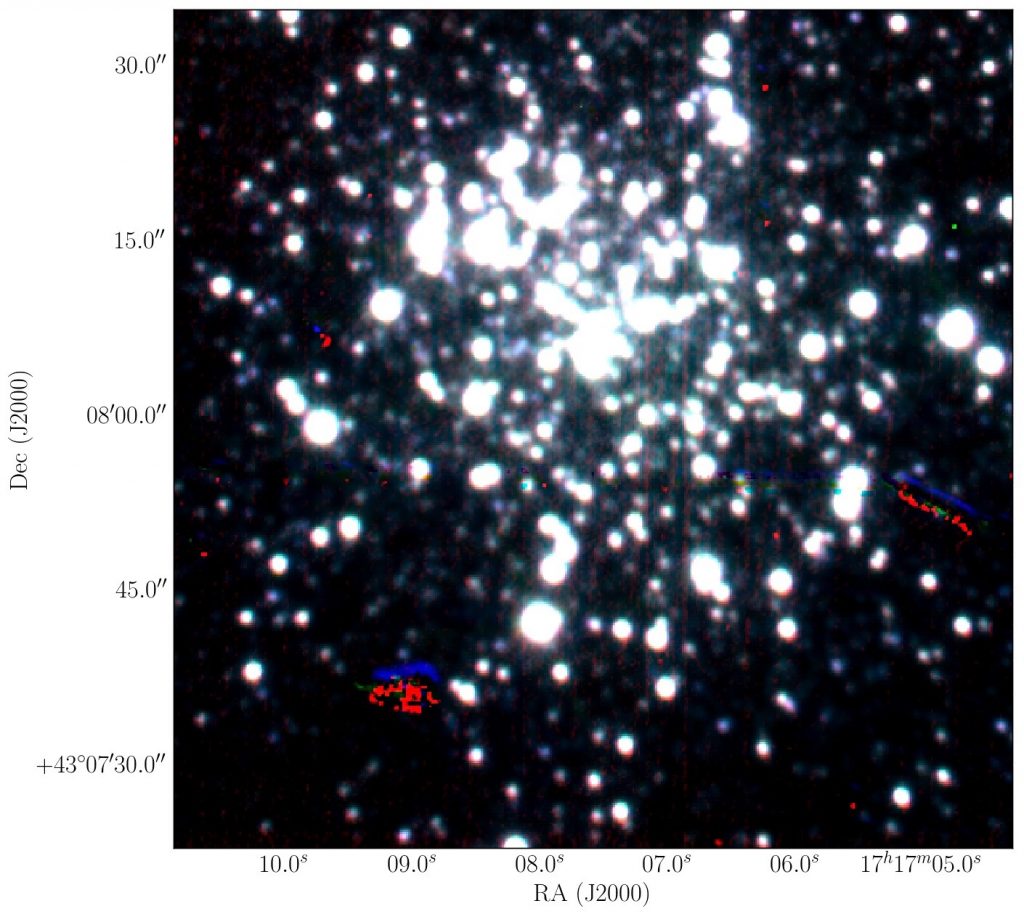
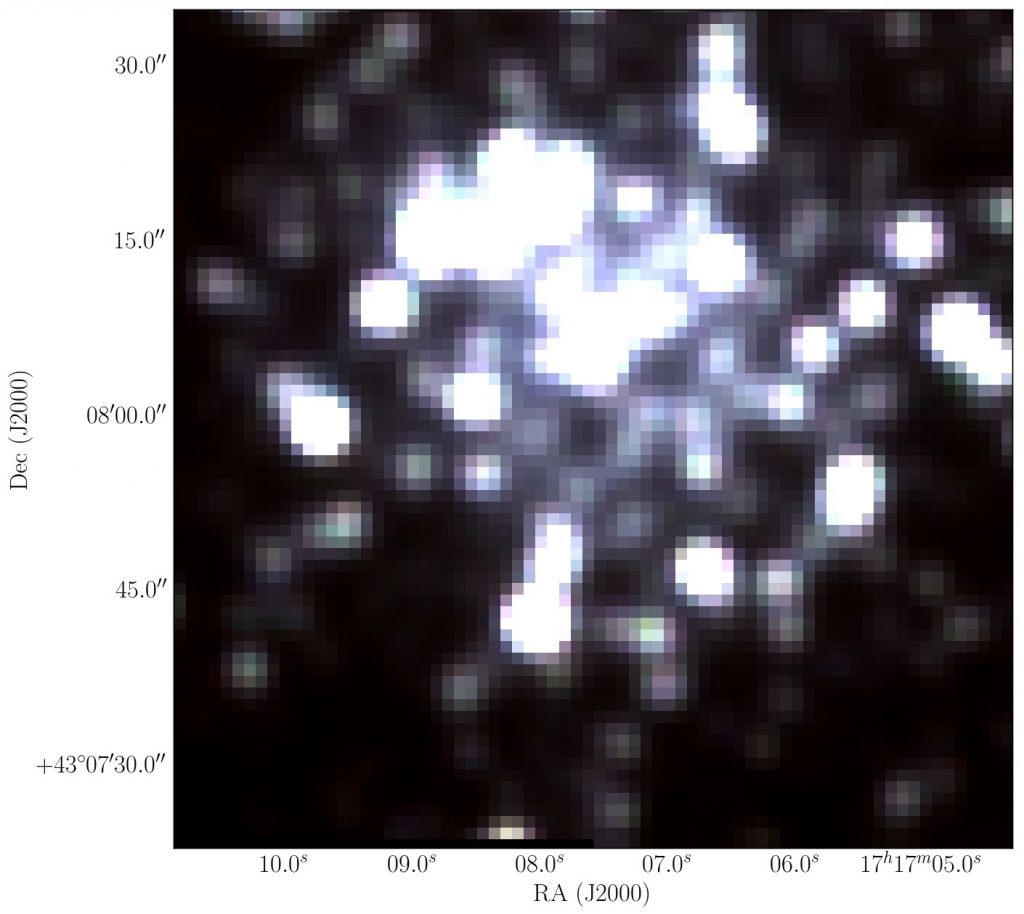
Figure 6: RGB colour composite image (red: K, green: H, blue: J) of M92, a Galactic globular cluster, generated using TIRCAM2 with the 3.6m DOT (upper), and 2MASS (lower).
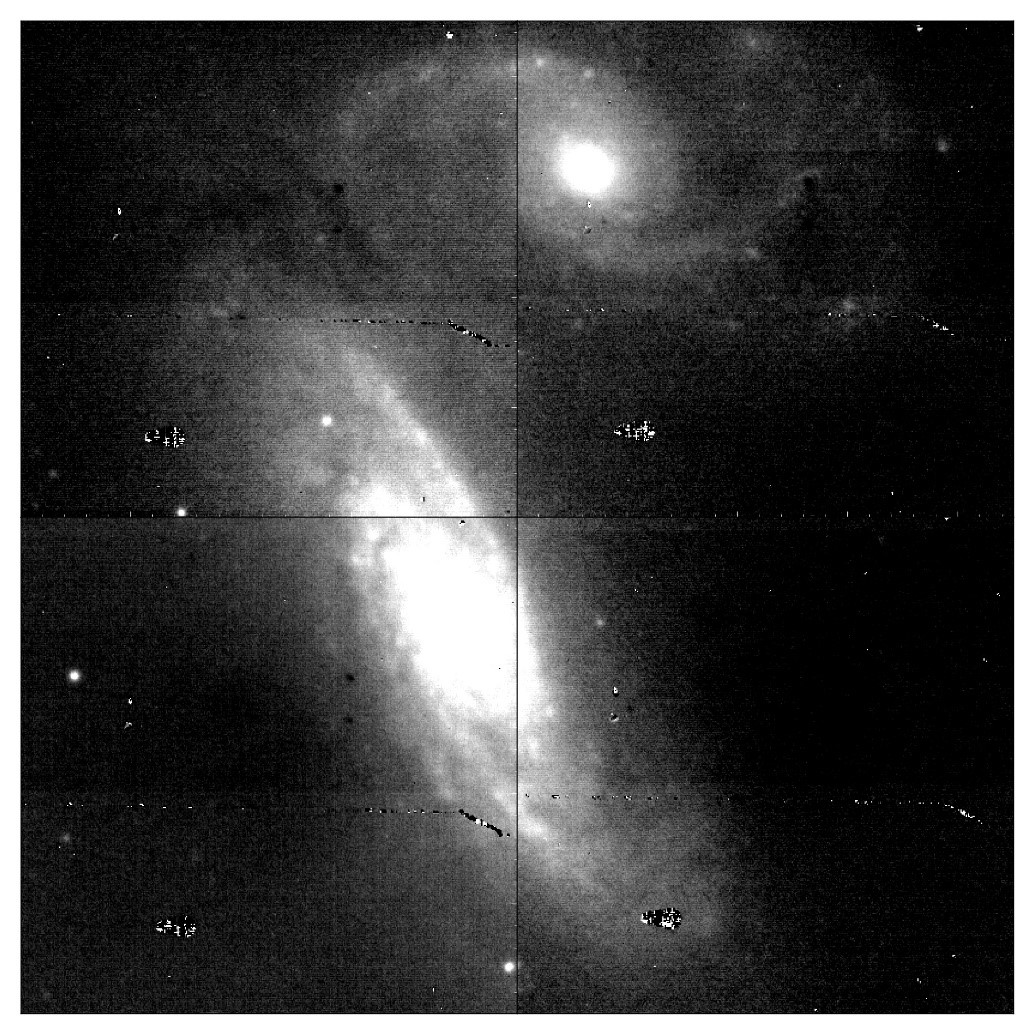
Figure 7: Mosaic of four TIRCAM2 J-band images (each with 550 sec exposure) of NGC 4567 and NGC 4568 twin galaxies observed on 15 May 2017.
nbL-band detection and observing possibilities:
An array of nbL-band (λcen ~ 3.59 µm) images (100×100 pixels cut-outs) for different magnitude stars is shown in Figure 9. The sources up to nbL magnitude of 6.0 are aligned and combined as they are visible even in the short exposure frames of 0.001s or 0.05s, which finally helps us to achieve a better signal-to-noise ratio in the combined image. However, sources having nbL magnitudes fainter than 6 are co-added blindly. A substantial difference in signal-to-noise ratio can be observed depending up on if they are aligned and combined or co-added blindly (see Figure 10). Hence, a source fainter than 8.0 mag in the nbL band is possible to observe if a bright source is present in the frame for alignment.
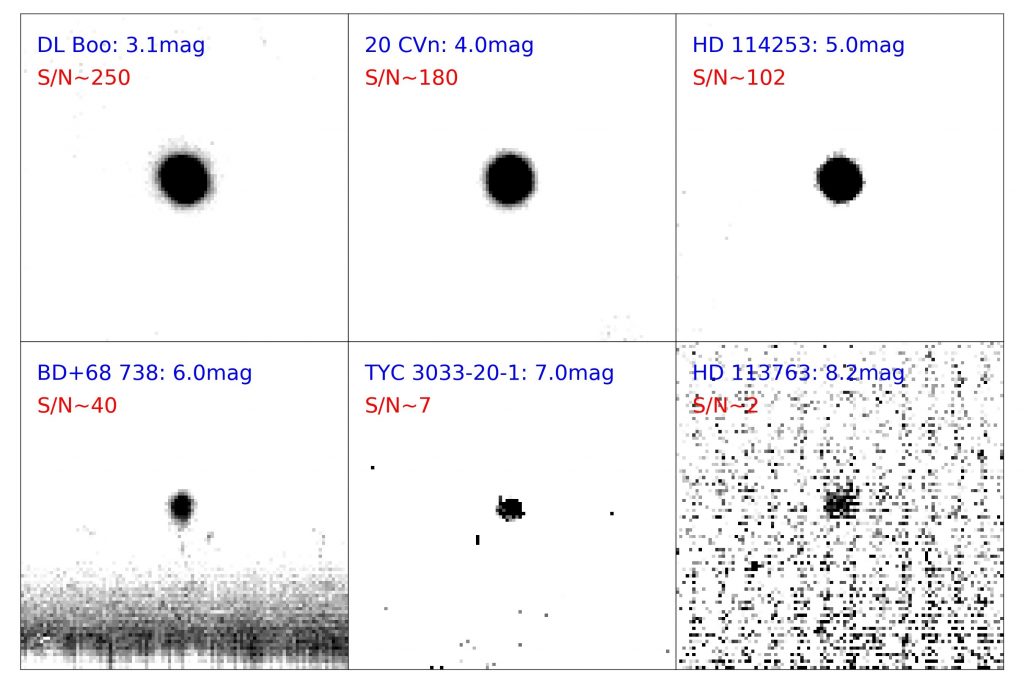
Figure 9: Mosaic of nbL band images (100×100 pixels cut-outs) observed during 13-14 May 2017. Sources brighter than 6 nbL mag are aligned and combined and the remaining sources are co-added blindly.
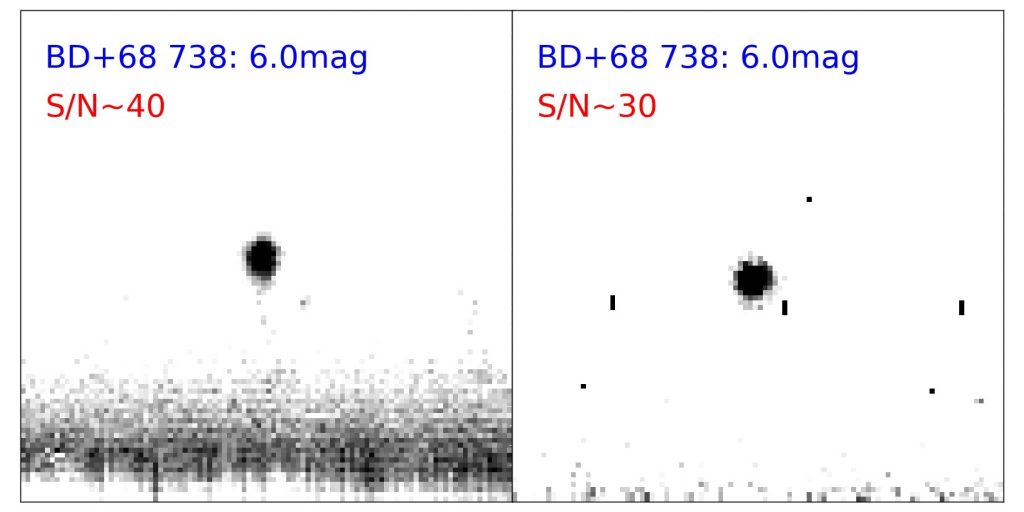
Figure 10: Similar to Figure 9, frames (100×100 pixels cut-outs) co-added after alignment (left) and blindly (right). The signal-to-noise ratio improves if they are aligned and then combined.
Figure 11 shows the plot of instrumental magnitudes calculated using log of ADUs/sec versus standard L-band magnitudes (W1 band; 3.4 µm) from the WISE. The plot shows that our array is linear in the L magnitude range from 3.0 to 8.0 in spite of scatter in the data in the fainter magnitude regime. The scatter is possibly seen because of variable sky conditions with high humidity of more than 60%.
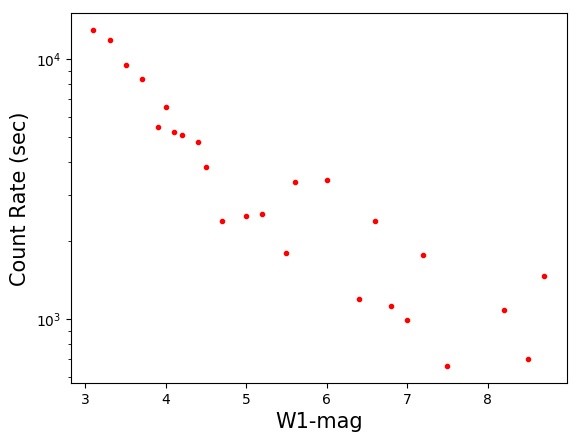
Figure 11: Count rates (in ADUs/sec) versus actual L-band magnitudes from WISE (W1 band), showing linearity of TIRCAM2 in the nbL-band. Scatter towards the fainter magnitude regime is seen possibly because of variable sky background due to high humidity.
Detection of PAH emission:
Emission in the PAH band (3.27 µm) towards Sh2-61 centre region is detected with an effective exposure time of 6.6 sec. We have also observed the region in the nbL-band for same exposure time for continuum subtraction. The left panel in Figure 12 shows the continuum-subtracted PAH band image of 30 x 30 arcsec2 area towards the Sh2-61 centre region. PAH emission is detected with a signal-to-noise ratio of 6.
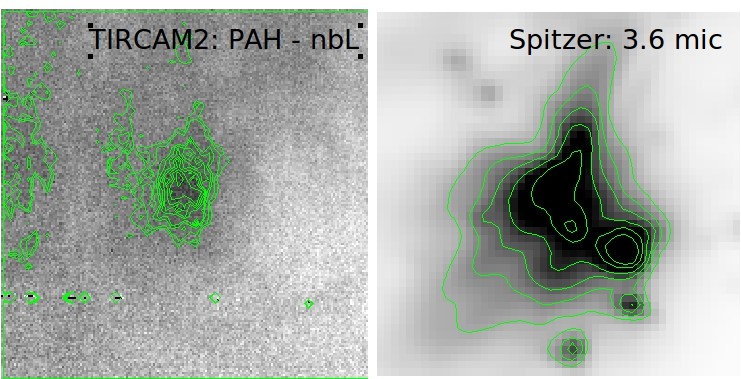
Figure 12: The left panel shows the continuum-subtracted PAH band image of 30 x 30 arcsec2 area towards the Sh2-61 region. Contours are overlaid for clarity. Spitzer 3.6 μm image for the same area is also presented for comparison in the right panel.